
Chart.js Bar Graph
Published at15 Jun 2026
Created by M Ichsanul Fadhil
Bar charts are one of the most common ways to compare data side by side — sales by month, scores by team, or traffic by channel.
In this challenge, you will build a
Chart.js Bar Graph
that compares monthly sales across two years. Use Chart.js to create a bar chart with multiple datasets, custom colors for each year, a legend to tell them apart, and styled gridlines.
Load Chart.js from CDN, create a canvas element with the right ID, and configure the chart with labels, datasets, and responsive sizing.
Algorithm Flow
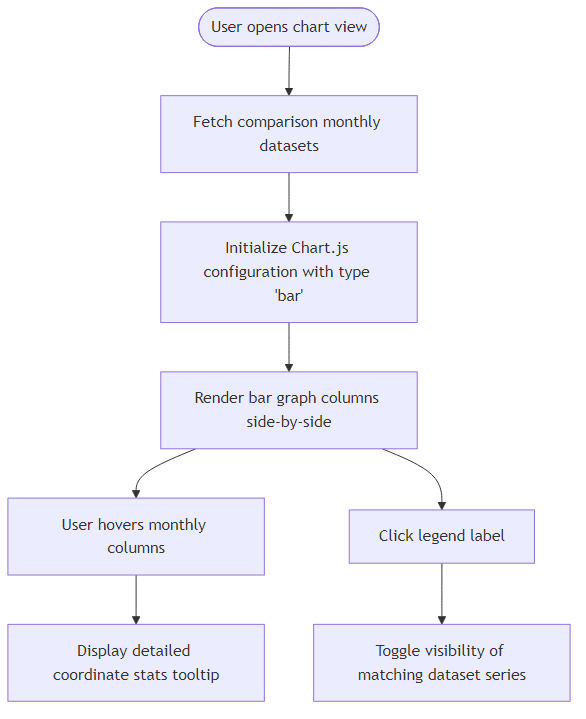
Recommendation Algorithm Flow for Chart.js Bar Graph
Best Answers
Solutions Coming Soon
Verified best solutions for this Challenge are still being analyzed and will be available soon.
Comments (0)
Join the Discussion
Share your thoughts, ask questions, or help others with this Challenge.