
Chart.js Bubble Scatter
Published at15 Jun 2026
Created by M Ichsanul Fadhil
Scatter plots show relationships between two values, but bubble charts add a third dimension — size — making them great for showing complex data at a glance.
In this challenge, you will build a
Chart.js Bubble Scatter
chart. Each bubble represents a data point with three values: X coordinate, Y coordinate, and radius (size). For example, you could plot advertising spend (X), sales (Y), and market share (bubble size).
Load Chart.js from CDN, create a canvas element, and configure a bubble chart with multiple datasets in different colors.
Algorithm Flow
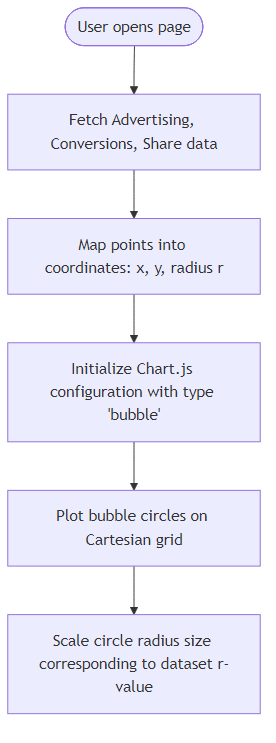
Recommendation Algorithm Flow for Chart.js Bubble Scatter
Best Answers
Solutions Coming Soon
Verified best solutions for this Challenge are still being analyzed and will be available soon.
Comments (0)
Join the Discussion
Share your thoughts, ask questions, or help others with this Challenge.