
Chart.js Line Graph
Published at15 Jun 2026
Created by M Ichsanul Fadhil
Line graphs are the go-to choice for showing trends over time — website visitors by month, stock prices by day, or temperature by hour.
In this challenge, you will build a Chart.js Line Graph that plots monthly visitor data. Use Chart.js to create a line chart with custom data points, smooth line tension, styled gridlines, and hover tooltips that show exact values.
Load Chart.js from CDN, create a canvas element with the right ID, and configure the chart with month labels and visitor counts.
Algorithm Flow
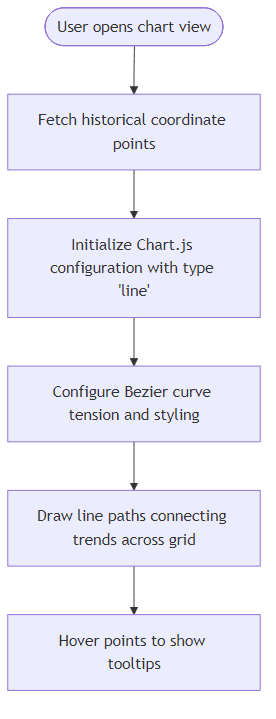
Recommendation Algorithm Flow for Chart.js Line Graph
Best Answers
Solutions Coming Soon
Verified best solutions for this Challenge are still being analyzed and will be available soon.
Comments (0)
Join the Discussion
Share your thoughts, ask questions, or help others with this Challenge.