
Chart.js Donut Share
Published at15 Jun 2026
Created by M Ichsanul Fadhil
Donut and pie charts are perfect for showing how a whole is divided into parts — market share, budget allocation, or survey results.
In this challenge, you will build a
Chart.js Donut Share
chart showing device market share percentages (Mobile, Desktop, Tablet). Use Chart.js to create a doughnut chart with custom segment colors, a legend, and hover tooltips that display the exact percentage.
Load Chart.js from CDN, create a canvas element with the right ID, and configure the chart with labels, data values, and color settings.
Algorithm Flow
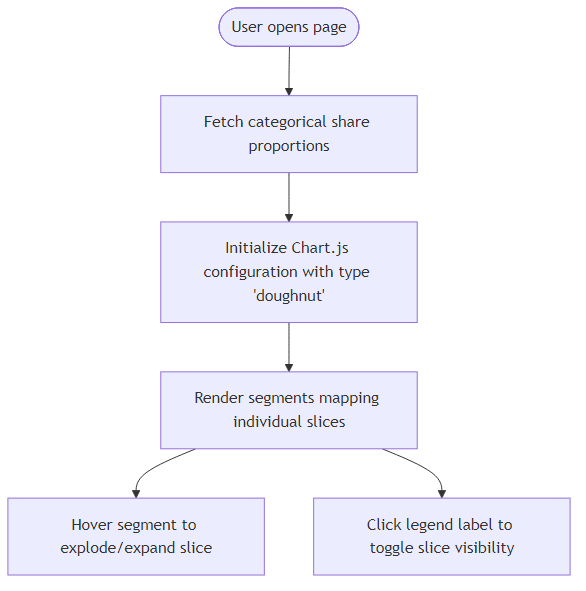
Recommendation Algorithm Flow for Chart.js Donut Share
Best Answers
Solutions Coming Soon
Verified best solutions for this Challenge are still being analyzed and will be available soon.
Comments (0)
Join the Discussion
Share your thoughts, ask questions, or help others with this Challenge.