
Chart.js Radar Matrix
Published at15 Jun 2026
Created by M Ichsanul Fadhil
Radar charts (also called spider charts) are great for comparing multiple qualities at once — product features, skill ratings, or performance metrics across different categories.
In this challenge, you will build a Chart.js Radar Matrix that compares two products across five dimensions (Speed, Design, UX, Price, Support). Each product appears as a colored polygon on the radar grid.
Load Chart.js from CDN, create a canvas element with the right ID, and configure a radar chart with multiple datasets, axis labels, and grid styling.
Algorithm Flow
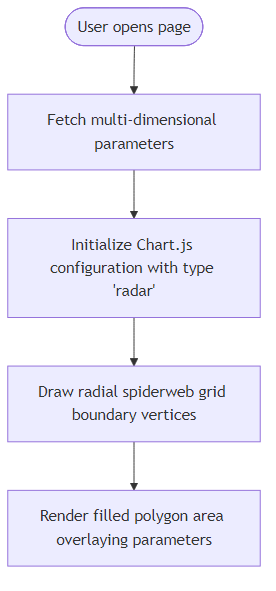
Recommendation Algorithm Flow for Chart.js Radar Matrix
Best Answers
Solutions Coming Soon
Verified best solutions for this Challenge are still being analyzed and will be available soon.
Comments (0)
Join the Discussion
Share your thoughts, ask questions, or help others with this Challenge.